
Chapter Expectations
- Investment needed
- Maintenance cost
- ROI for dispensers
- Breakeven analysis
Introduction to Finance
The financial viability of refill systems is crucial for their success and scalability. While refill models offer significant environmental benefits, understanding the economics is essential for making informed business decisions. This chapter provides practical tools and frameworks to assess the financial aspects of implementing refill systems, from initial investment to long-term profitability.
The transition to refill requires upfront investment, but when properly implemented, can deliver substantial cost savings for businesses and consumers alike. For example, case studies across Asia demonstrate that refill systems can achieve 15-20% cost savings per transaction for consumers while providing 15-20% operational savings for retailers[1].
However, achieving profitability remains a key challenge, especially in unregulated markets where not all models are financially viable from the start. It is essential to identify specific opportunities such as B2B setups, closed ecosystems (e.g., offices, schools, campuses), or regulated markets where refill solutions can more quickly gain traction and deliver returns. In this context, revenue generation should be treated as the primary KPI to validate product-market fit and investor confidence. From the beginning, business models must be designed with profitability and scalability in mind, ensuring that environmental impact goes hand in hand with economic sustainability.
Understanding Refill Costs
Identifying all costs involved in the refill to understand pricing and when implementers can expect a return on investment.
Before you dive into financial modeling, it’s helpful to understand the types of costs involved in setting up and running a refill system.
Costs typically fall into two major categories:
- Setup costs: one-time investments to get your refill model off the ground
- Operational costs: recurring expenses to keep it running smoothly
These are later detailed in the CAPEX (capital expenditure) and OPEX (operational expenditure) sections, but here’s an overview to orient your planning.
Cost Overview
Implementing a refill system requires initial investment across several key areas:
- Dispenser
The choice of dispenser has a significant impact on upfront and ongoing costs. As outlined in the previous chapter, the selection, whether manual, semi-automated, or IoT-enabled depends on your context, including product type, consumer interaction needs, data requirements and available budget.
From a financial standpoint, businesses should evaluate not just the purchase cost, but also installation, maintenance, and potential upgrade costs. For example, low-tech manual dispensers may require less capital but more labor, while smart dispensers offer automation and data tracking benefits at a higher financial, maintenance and labour skill investment. Understanding these trade-offs is critical to aligning your financial planning with your operational model.
- Infrastructure Setup
- Space modification and preparation
- Plumbing and electrical connections (if required)
- Storage for bulk products
- Signage and customer education materials
- Inventory and Working Capital
Another investment you need to consider is the product itself to get started! You’ll need to invest in product inventory and ensure you have enough working capital to maintain day-to-day operations.
Initial expenses:
- Initial bulk product purchase to stock your dispensers
- Container inventory (if providing reusable/ refillable containers) – this may include B2B containers for bulk transport/refill delivery to dispensing sites, and B2C reusable containers if your model provides or sells containers directly to end consumers.
- Safety stock to ensure continuous availability
- Operational funds to cover ongoing costs such as logistics, staffing, and utilities — as well as a financial buffer to manage potential delays in customer payments or supply chain disruptions
- Compliance and Certification
The type of product you will dispense, combined with where you will dispense (country / region) will determine what regulations you need to follow. You will need to research the specific compliance information based on your individual context, including but not limited to:
- Health and safety certifications
- Training for staff
- Quality control systems
- Packaging and product labeling requirements on reusable/refillable containers
These compliance costs can vary significantly depending on the product category. For example, refill models for food and beverage products may require stricter hygiene standards and certifications (such as Hazard Analysis and Critical Control Points/ HACCP or food handling licenses), while personal care items like shampoo or lotion may involve cosmetic safety testing and labeling compliance. In contrast, dry goods or cleaning products may have fewer restrictions but could still require quality assurance protocols.
Examples of typical compliance-related costs include:
- Laboratory testing fees for product safety such as microbial analysis or preservative efficacy testing for refillable shampoo, soap, or food products. In the EU, this is required under cosmetic and food safety regulations (e.g., EC 1223/2009 and EC 852/2004). In Latin America, similar tests are needed to comply with national standards like ANVISA (Brazil) or COFEPRIS (Mexico). In Asia, countries like Vietnam and the Philippines require microbiological and chemical testing approved by their respective food and drug authorities.
- Certification application or renewal fees including costs to obtain or renew GMP, HACCP, or FDA-equivalent licenses. In the EU, GMP is mandatory for cosmetics and HACCP for food operators. In Latin America, sanitary registration often requires both documentation and site inspections. In Asia, certification fees may include Halal compliance, country-specific product registration, or environmental licenses for reusable packaging systems.
- Staff training programs required by local health departments such as hygiene and handling training. In the EU, this is a legal obligation under food hygiene laws; in Latin America, public health agencies require similar protocols, especially for products sold in bulk or reused packaging. In Asia, training is often part of local licensing conditions, especially in countries with fast-growing reuse regulations like Thailand or Indonesia.
- Packaging and labeling updates to comply with refill-related regulations including ingredient disclosures, safety instructions, traceability codes, and refill warnings. In the EU, labeling must meet regulations such as EU No 1169/2011 for food and 1223/2009 for cosmetics. Latin American countries often require label translation and INCI formatting. In Asia, packaging laws may require information in multiple languages, clear refill instructions, recycling symbols (e.g., Japan, Singapore), and pace on the container for displaying this information legibly and durably.
Understanding these cost drivers early on is essential to avoid delays, ensure safe operations, and build customer trust. These costs should be factored into your overall financial planning and unit economics.
Challenge: Unlike disposable packaging, reusable containers often have limited space for required labeling. Businesses may need to invest in smart labeling (QR codes or NFC tags), durable printing methods, or modular labeling systems (e.g., attachable info cards or sleeves). These methods involve upfront investment and recurring maintenance costs.
Tip: Explore collaborative certification approaches, such as shared bulk dispensers in certified facilities or co-branded refill stations, to reduce costs.
CAPEX and OPEX
Capital Expenditure (CAPEX)
CAPEX represents the one-time investments needed to establish your refill system.
While some costs, such as dispensers and infrastructure, are presented in the earlier Cost Overview section, all investment categories are fully detailed in this CAPEX table.
Below is an example of estimated capital expenditure (CAPEX) costs for different types of refill setups. These are indicative ranges based on real-world implementations (based on Algramo experience).
Actual prices will vary depending on product type, supplier, geography, and scale. You will need to research these variables to determine the final cost. Check out our hardware directory to access validated providers as a starting point.
Reference:
Typical CAPEX Categories and Cost Ranges
|
Cost Item |
Low-end dispenser (Manual or low-tech setups) |
Mid-range (Partially automated systems with moderate tech) |
High-end (Fully integrated systems with IoT tracking, digital interfaces, and brand-grade quality) |
|
Dispenser cost |
$100–$300 (manual pump or gravity-fed) |
$1,000 -$1.500(semi-automated) |
$2,00–$3,000+ (IoT-enabled, app-connected) |
|
Infrastructure Setup cost |
$100 (basic modifications) |
$250 (signage, wiring, plumbing) |
$500+ (custom fixtures, utilities) |
Operational Expenditure (OPEX)
OPEX includes ongoing costs to run the refill system:
You should consider the following operational costs as part of your analysis.
- Product procurement (bulk purchasing typically 20-30% lower than packaged alternatives)
- You should expect a dramatic cost reduction if you increase the volume of the bulk container – the bigger the cheaper.
- Labor costs for restocking and maintenance
- Utilities (electricity, water, internet)
- Maintenance and repairs (2-5% of equipment cost annually)
- Two main types of maintenance:
– Preventive maintenance (scheduled cleaning or calibration after a set number of uses or time)
– Corrective maintenance (on-the-spot repair if something fails)
- Two main types of maintenance:
- Stocking essential spare parts (e.g., nozzles, valves, sensors) to reduce equipment downtime.
- Marketing and customer education
- Quality control and testing
Cost-saving tip: The larger the bulk container, the lower the unit cost. For example, 1,000L tanks are significantly more economical per liter than 20L jerrycans.
To support practical planning, we recommend using a (downloadable) OPEX template.
|
No. |
Category |
Description |
Unit Cost (USD) |
Frequency (monthly, quarterly, etc.) |
Estimated Monthly Cost (USD) |
|
1 |
Product procurement |
Bulk purchasing of product (e.g., 20L, 200L, 1000L containers) |
|
|
|
|
2 |
Restocking and logistics |
Transport, storage, and handling of bulk goods |
|
|
|
|
3 |
Labor costs |
Wages for staff performing restock, cleaning, and support |
|
|
|
|
4 |
Utilities |
Electricity, water, internet costs |
|
|
|
|
5 |
Preventive maintenance |
Routine cleaning, calibration, and servicing |
|
|
|
|
6 |
Corrective maintenance (on-spot repairs) |
Emergency fixes and unscheduled repairs |
|
|
|
|
7 |
Spare parts |
Stocking gaskets, valves, tubing, sensors, etc. |
|
|
|
|
8 |
Quality control and testing |
Lab tests, hygiene audits, internal quality checks |
|
|
|
|
9 |
Marketing and customer education |
Signage, campaigns, training materials, promotions |
|
|
|
Accounting for Product Losses: Spillage, Expiry & Unsold Inventory
Real-world refill operations frequently encounter product losses that impact margins. These include:
- Spillage or leakage during handling, transfer, or dispensing
- Expiry of products, especially in categories with limited shelf lives
– For food and beverage items, expiry is a well-documented risk.
– For personal care products (like natural shampoo or lotion), preservative-free formulas may degrade over time.
– While most conventional cleaning products (e.g., bleach or commercial detergents) have long shelf lives, bio-based or eco-friendly cleaners often contain natural ingredients (e.g., enzymes, vinegar, citrus extracts) that can degrade or lose effectiveness over time, especially if exposed to air or heat.- Tip:
Use first-in, first-out (FIFO) inventory tracking and clearly label refill containers with batch numbers and restock dates. This reduces expiry risk and supports traceability in case of quality issues.
- Tip:
To ensure realistic financial projections, factor these in as a loss allowance, typically 1–5% of your monthly inventory value depending on your product type. This should be validated with your manufacturer or supplier, who can provide more accurate estimates based on product characteristics (e.g., viscosity, degradation, container compatibility).
Risk mitigation tips:
- Choose products with long shelf life or stable properties.
- Practice FIFO (first in, first out) inventory rotation.
- Design spillage-resistant dispensers and tight storage systems.
- Utilize time-based promotions to clear out older stock.
Including these risks upfront in your budget gives a more accurate picture of profitability and reduces surprises down the line.
Tip/Popup: The Kuha sa Tingi project in the Philippines demonstrated that micro-retailers could achieve 15% higher profits through refill systems due to reduced packaging costs and higher margins[2].
Calculating ROI
ROI Formula for Refill Systems
Below is a simple equation to calculate the RoI of your investment in a refill system. Experiment with different scenarios and assumptions to determine if your model will be effective.
For example: How many refills per day are you estimating? What are your margins? How much do the dispensers cost?
Tip: If you’re struggling to see a positive number at the end, consider a return model instead (link to return section).
|
ROI = (Net Profit from Refill Operations / Total Investment) × 100 |
Where:
- Net Profit = Revenue from refill sales – Operating costs (OPEX)
- Total Investment = CAPEX + Initial working capital
Key Factors Affecting ROI
- Sales Volume: Higher throughput reduces per-unit costs
- Product Mix: Higher-margin products improve ROI
- Customer Adoption Rate: Impacts revenue generation
- Operational Efficiency: Affects ongoing costs
- Margin
- Number of refills
Example ROI Calculation
Real-World Insights:
Algramo (Chile)
Algramo deployed smart dispensing systems for cleaning products and dry goods in various retail formats. Based on their pilot deployments in neighborhood shops, retailers using Algramo’s smart dispensers have reported a payback period of 10-14 months, depending on foot traffic, product mix, and customer engagement.
Links:
Cost savings of ~30-40%:
According to Harvard’s case study, Algramo cuts pricing for end consumers by about 30-40% by eliminating middle‑men, packaging, and logistics costs.
https://d3.harvard.edu/platform-rctom/submission/algramo-the-value-add-vending-machine/
Fast Company and UNEP also confirm that low‑income consumers pay up to 30-50% more in small formats – Algramo eliminates that “poverty tax” to deliver savings of 30-40%
Reuse rates around 80%:
Closed Loop Partners reports that Algramo achieves an 86% return rate in its reuse model
https://www.closedlooppartners.com/case-studies/incentivizing-reuse-systems/
15 refills per bottle / ~2 kg plastic saved:
World Economic Forum describes a Unilever pilot where some customers refilled a detergent container 15 times, avoiding around 2 kg of plastic waste per unit
https://www.weforum.org/stories/2021/04/algramo-reusable-smart-packaging/
iRefill (India)
Based on iRefill’s experience with their B2B model in India, retailers can achieve payback within 12-18 months for edible oil dispensers and 12 months for cleaning liquid dispensers[3].
Hypothetical ROI Example: Small Retailer with 2 cleaning liquid dispensers
|
Cost Component |
Amount (USD) |
|
CAPEX (dispenser + setup) |
2,500 |
|
Initial working capital |
500 |
|
Total Investment |
3,000 |
|
Monthly Refill Revenue and Costs |
800 |
|
Less: Cost of Goods Sold (COGS) |
300 |
|
Monthly OPEX (labor, utilities, maintenance) |
500 |
|
Monthly Net Profit (800 – 300 – 500) |
0 |
|
In this case, the retailer breaks even monthly. Profitability and ROI improve with lower COGS or increased sales volume. |
|
ROI (Year 1) = (NetProfit × 12) ÷Total Investment (Net Profit × 12) ÷ Total Investment (NetProfit×12) ÷ Total Investment × 100
→ ROI = (0 × 12 ÷ 3,000) × 100 = 0%
Payback Period = Not achieved in Year 1
Note: OPEX in this example includes recurring costs like labor, utilities, and marketing
Calculating Your Breakeven Point
The breakeven point indicates when your refill system will start generating profit:
|
Breakeven Point (units) = Fixed Costs / (Price per unit – Variable cost per unit) |
Factors Influencing Breakeven
- Fixed Costs: Equipment depreciation, rent allocation, base labor
- Variable Costs: Product cost, utilities per refill, transaction costs
- Pricing Strategy: Balance between competitiveness and profitability
- Market Demand: Local acceptance of refill models
- Usage rates
Margins
Benchmark and Performance Expectations
To better understand what your model could look like, here are some industry benchmarks based on real-world implementations to consider.
Refill Frequency by Product Type
|
Product type |
Average refill rate / user |
Key Influencing Factors |
|
Cleaning products |
1 time/month Every 30-40 days |
Household size, product variety |
|
Staple food… |
2–4 times/month |
Family size, storage options |
|
Personal Care (shampoo, soap) |
1–2 times/month |
Skin/hair type, refill sizes |
|
Cooking Oils |
1–2 times/month |
Meal frequency, oil type |
Note: The figures in the table are not targets, but useful reference points to test your assumptions.
Tip: When planning your refill model, consider estimating # of refills per day per dispenser and customer conversion rates. Based on Algramo’s experience, a «good» refill rate is over 70%. In a retail space, this could take between 6 and 8 months to reach.
Customer Metrics to Monitor
|
Metric |
Target / Benchmark |
|
Customer Retention Rate |
>60% within 3 months |
|
Average Transaction Size |
USD $1.50–$4.00 per visit |
|
Refill Frequency |
Weekly to bi-weekly per product |
|
Dispenser Utilization Rate |
>30% of refill capacity/month |
Note on Variability:
Refill rates can vary based on household size, location (urban vs. rural), climate, and cultural habits. These numbers serve as a starting point. It’d be best to pilot and gather local data before scaling.
Forecasting and scale – TAM/SAM/SOM, adoption, etc… test with a pilot.
Scale
Economies of Scale in Refill
As your refill operation grows, per-unit costs typically decrease due to:
- Bulk purchasing power: Larger orders command better prices
- Operational efficiency: Optimized processes and routes
- Shared infrastructure: Distribution of fixed costs
- Technology leverage: Better utilization of smart systems
Scale Thresholds and Financial Impact
Use these phases of growth to forecast how your cost structure and financial goals might evolve:
- Startup Phase (0-100 customers/month): Focus on proving concept
- Growth Phase (100-500 customers/month): Optimize operations
- Scale Phase (500+ customers/month): Expand locations and products
Example: At 500+ users/month, a refill station may fully recover its CAPEX in 8 months instead of 12 due to higher turnover and reduced per-unit costs.
Pricing strategies for consumers
Pricing Strategies: Added a paragraph under the B2B B2C vs. B2B Models
Refill pricing needs to deliver value to users while ensuring financial sustainability. Your pricing strategy should reflect whether you’re selling directly to consumers (B2C) or via retail or distribution partners (B2B).
B2C: Pricing for End Consumers
Successful B2C refill models typically offer savings of 15–35% compared to traditional packaged goods. This makes reuse more appealing while promoting loyalty.
Successful B2C refill models aim to offer noticeable cost savings compared to traditional packaged goods. This perceived value can help attract price-sensitive consumers and build brand loyalty over time.
Pricing Components:
● Base product cost (bulk rate)
● Operating margin: 10–20% to cover OPEX Typically designed to cover operating costs, which may vary depending on location, labor, and service level.
● Incentive discount: 5–15% to encourage adoption
● Volume discounts: for larger refill quantities (e.g., bring a 1L container, pay less per ml)
Dynamic Pricing Strategies
- Introductory Pricing: Lower margins initially to build a customer base
- Volume-based Pricing: Encourage larger refills with better rates
- Loyalty Pricing: Reward frequent customers
- Peak/Off-peak Pricing: Manage demand and capacity
B2B information and margins?
B2B: Pricing for Retailers or Partners
B2B refill models often benefit from more stable revenue streams due to longer-term contracts and higher-volume orders. Rather than selling dispensers or equipment, refill implementers focus on providing refill-as-a-service solutions. In this case, value is delivered not only through competitive pricing of consumables but also through bundled service offerings such as inventory management, dispenser maintenance, staff training, and data reporting.
These added services strengthen partnerships and make it easier to justify pricing, while improving operational efficiency and customer satisfaction. While specific margins vary based on the business model and scope of services, B2B contracts allow implementers to build recurring revenue and improve unit economics through scale and long-term engagement.
To remove?
What about margins for hardware companies/ refill companies selling B2B, ie dispensers to a retailer? Over 50%. That is not included here.
Financial instruments and financial incentives for implementers
Ie: early adopters of the platform. discount on hardware, consultancy, premium access
Ensuring a financially sustainable refill model is one of the biggest challenges you will face, along with consumer adoption. Let’s take a look at a few incentives that can help you increase sales and get early adopters to start using your refill solutions These incentives are designed to reduce barriers to entry and accelerate the implementation of sustainable refill solutions.
Early Adopter Incentive Package
These are potential offerings that reuse platforms or ecosystem partners (not hardware companies themselves) can facilitate to support early adopters. Final packages would depend on available partnerships and funding sources.
(Move to GTM)
- Hardware Access and Financial Options / Discount Program
- Tier 1 (First 50 implementers): [%] discount on verified hardware from platform partners
- Tier 2 (Next 100 implementers): [%] discount on hardware solutions
- Tier 3 (Next 250 implementers): [%] discount on equipment such as refill dispensers, smart containers (in some models), and possibly supporting devices like weighing scales, IoT integrations, or POS terminals.
- Exclusive access to beta hardware solutions from innovation partners
Instead of traditional discounts, early implementers may benefit more from:
- Leasing or rental options for refill hardware through platform partners
- Rent-to-own models with manageable monthly payments
- Deferred payment plans tied to implementation milestones
- Access to refurbished or shared-use equipment to lower capital costs
- Consultancy Services
- Free Initial Assessment (USD 500 value) for first 100 platform users
- Subsidized Implementation Support:
- [#] hours free consultation for refill system design
- [%] discount on extended consultancy services
- Access to expert network for troubleshooting
- Ongoing Support Credits: Monthly consultation hours based on implementation size
- Premium Platform Access
- Priority listing on the reuse platform’s map or directory
- Free or early access to beta versions of digital tools (e.g., inventory systems, tracking dashboards)
- Promotion through platform communications and storytelling
|
Benefits |
Starter Package |
Premium Package |
Enterprise Package |
|
|
Platform Directory Listing |
|
Priority listing (highlighted)
|
Featured placement with logo & case
|
|
|
Digital Tools Access |
Access to basic tools |
Access to advanced tools |
Beta access to new modules + analytics |
|
|
Platform Promotion |
Included in general updates |
Dedicated social post / newsletter |
Success story + multi-channel campaign |
|
|
Advisory Support (group) |
Knowledge base access |
Webinars & Q&A with experts |
1-on-1 business advisory sessions |
|
|
Implementation Toolkit |
Basic starter kit (downloads) |
Premium toolkit (customizable) |
Enterprise-level toolset + templates |
|
|
Data & Impact Dashboard |
Not included |
Standard impact metrics dashboard |
Customized dashboard & reporting tools |
|
|
Networking Opportunities |
General community access |
Curated peer-learning group |
Exclusive access to pilot partners and funders |
|
|
Annual Fee (indicative – to be adapted per market) |
Free or symbolic fee |
Moderate (sliding scale by size) |
Premium pricing, or via corporate sponsor |
|
Insights into Algramo Financial Model – what could we share? |
Case studies
Financial models from successful implementations
5 case studies outlined in detail, mainly restaurants/fast food – financial models/savings 5+Reuse+Business+Profiles.pdf
UK Modeling example[4]
The modelling data shows that Refill In-Store delivers:
- a significantly lower (26%) E2E cost per case (£2.27 vs £3.07)
- a significant (94%) reduction in pEPR costs
- a significant (93%) reduction in packaging-related emissions
- a significant (94%) reduction in packaging materials/ waste.
Tech-Enabled Refill: Davaam Life, Pakistan[5]
Davaam’s automated refill dispensers demonstrate financial viability through:
- 15-20% cost savings for consumers
- Annual subscription model for retailers
- Reduced packaging and distribution costs passed to consumers
Community-Led Refill: Back2Basics, Philippines[6]
This zero waste bulk store achieves profitability through:
- 25-35% consumer savings on products
- 70% locally sourced products reducing costs
- Community engagement driving loyalty
Activities or exercises
What is needed to move on to next chapter?
Consider sharing a modified version of this as a template (from iRefill) https://docs.google.com/spreadsheets/d/1iXgranqsdXyYtjxiKfiMed7c0rd5pvWW/edit?usp=drive_link&ouid=110485532490710987023&rtpof=true&sd=true
Financial Planning Tools
Refill Financial Calculator
Use this framework to assess your refill venture:
- Initial Investment Worksheet
Estimate your startup capital needs, including:
- Equipment costs: Dispensers, containers, POS tech
- Installation expenses: Setup labor, electrical/plumbing adjustments
- Working capital needs: Inventory for launch, initial marketing, buffer funds
- Total CAPEX requirement: Sum of all above items
Tip: Ask dispenser providers for itemized quotations based on your expected volume and location setup.
- Operating Cost Projector
Forecast your fixed and variable monthly operating expenses:
- Product costs (COGS): Cost of refill goods per liter/kg
- Labor: Staff wages, shifts needed to operate and manage the station
- Utilities and maintenance: Electricity, water, minor repairs
- Marketing and supplies: Promotions, packaging (if needed), signage
- Total monthly OPEX: Sum of recurring monthly costs
Note: If your manufacturer offers consignment or refills based on sales, this can reduce upfront inventory costs.
- Revenue Forecaster
Estimate your monthly sales with realistic assumptions:
- Customer acquisition rate: Number of new users per month
- Refill frequency: How often a typical customer returns
- Average transaction value: Based on product mix and pricing
- Monthly revenue projection: (# of users × average refill frequency × average transaction size)
Example: 50 users × 2 refills/month × $2 = $200/month
- ROI Dashboard
Assess your profitability and timeline to recover your investment:
- Payback period: How many months to recoup total CAPEX
- Monthly cash flow: Revenue minus OPEX
- Annual ROI (%): (Net annual profit ÷ total investment) × 100
- Scenario planning: Run best- and worst-case forecasts
Consider modeling different user growth curves and costs under high/low demand to test resilience.
Call-out Box: Financing Checklist
□ Research available grants and subsidies in your area
□ Calculate your minimum viable investment
□ Identify potential brand partnerships
□ Develop a 3-year financial projection + impact
□ Create a contingency fund (10-15% of investment)
□ Plan for scaling milestones
OTHER RESOURCES FOR CONSIDERATION
Cost modeling example:
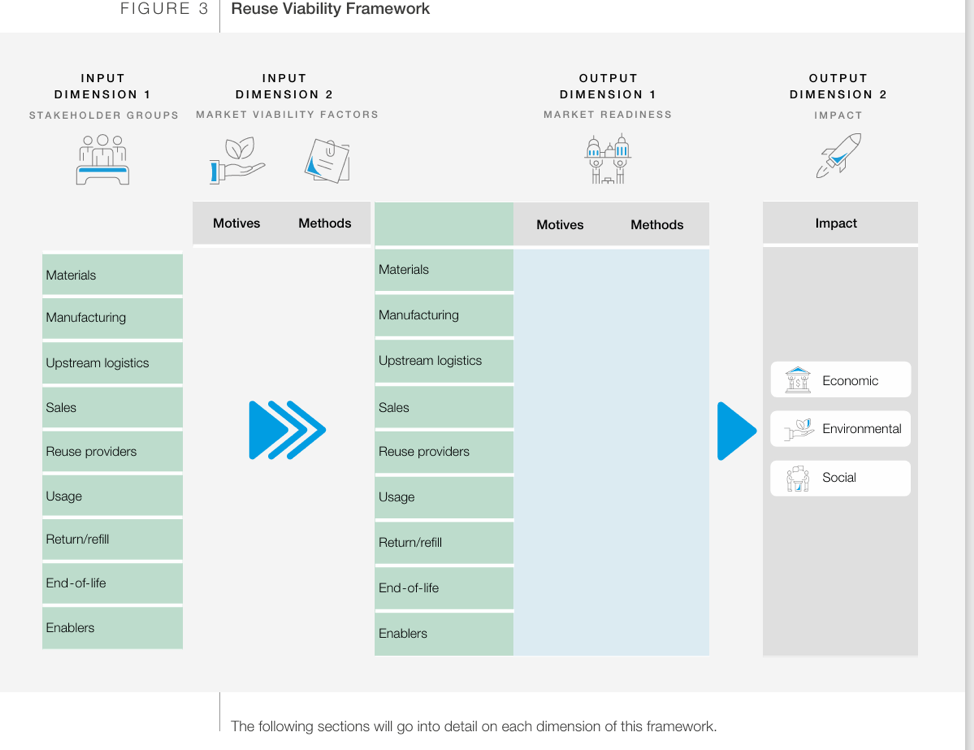
Reuse viability framework
WEF_IR_Future_of_Reusable_Consumption_2021.pdf
Global Resources: Funding & Solution Landscapes
To further support your financial planning, consider exploring these up-to-date global resources:
- Funding for Reuse Models (Reuselandscape.org)
A curated overview of grants, investment sources, and accelerator programs supporting reuse and refill systems globally.
https://www.reuselandscape.org/funding-for-reuse - Living Landscape of Reuse Solutions
An open database tracking reuse innovations, business models, and operational characteristics around the world—including refill dispensers, return schemes, and packaging-as-a-service.
Living Landscape Spreadsheet
These tools are especially useful for identifying potential funders, partners, and technologies you might want to pilot or replicate locally.
[1] UNPACKING REUSE IN ASIA: A BRIEF REPORT FEATURING SELECT CASE STUDIES ON REUSE SYSTEMS FOR PACKAGING
[2] UNPACKING REUSE IN ASIA: A BRIEF REPORT FEATURING SELECT CASE STUDIES ON REUSE SYSTEMS FOR PACKAGING
[3] UNPACKING REUSE IN ASIA: A BRIEF REPORT FEATURING SELECT CASE STUDIES ON REUSE SYSTEMS FOR PACKAGING
[4] 30percent-reuse-future-for-UK-report-GoUnpackaged.pdf
[5] UNPACKING REUSE IN ASIA: A BRIEF REPORT FEATURING SELECT CASE STUDIES ON REUSE SYSTEMS FOR PACKAGING
[6] UNPACKING REUSE IN ASIA: A BRIEF REPORT FEATURING SELECT CASE STUDIES ON REUSE SYSTEMS FOR PACKAGING